-
Email info@annnutr.org
-
Address 848 N. Rainbow Blvd. #5486 Las Vegas, NV 89107, USA
Department of Life Sciences, Sharda School of Bioscience and Technology, Sharda University, India.
*Corresponding author: Saleem Siddiqui
Department of Life Sciences, Sharda School of Bioscience and Technology, Sharda University, Greater Noida, Uttar
Pradesh 201310, India.
Email ID: saleem.siddiqui@sharda.ac.in
Received: Dec 17, 2025
Accepted: Feb 10, 2026
Published Online: Feb 17, 2026
Journal: Annals of Nutrition and Dietetics
Copyright: Siddiqui S et al. © All rights are reserved
Citation: Sharma U, Siddiqui S. Development and evaluation of non-heme iron fortified functional readyto-serve guava beverage with enhanced nutritional and bioactive properties. Ann Nutr Diet. 2026; 2(1): 1008.
Background and aim: Ready-To-Serve (RTS) fruit beverages are the most popular functional drinks with high palatability and ease of consumption, but are inherently low in Fe content. The present study was aimed at developing nonheme iron rich functional beverages using guava pulp blended with the extracts of Fedense plant sources. These beverages can be recommended as a cost-effective, and nutritious dietary intervention for the vegan section of the population suffering from Fe deficiency.
Methods: An optimal mixture design approach was employed to determine the appropriate levels of guava (Psidium guajava) pulp to blend in with either of the plant extracts of wheatgrass (Agropyron sp), seaweed Ulva lactuca, karonda (Carissa carandas) fruits, moringa (Moringa oleifera) leaves, and red amaranth (Amaranthus tricolor) leaves, resulting in 15 experimental formulations. Five formulations with the highest sensory score, one from each guava–plant combinations were selected, and subjected to various physicochemical and nutritional evaluations.
Results: Based on the optimized formulations, karonda and Ulva lactuca blends achieved their best sensory scores at a guava: extract ratio of 0.9:0.1, while moringa, wheatgrass, and amaranth blends showed maximum acceptability at 0.7:0.3, with the guavaamaranth formulation recording the highest overall sensory scores among the fortified beverages. The total phenolic content of the beverages varied from 23.07 to 31.21 mg GAE/100 ml, with the guava–moringa formulation exhibiting the highest phenolic content. Vitamin C content ranged from 7.95 to 14.77 mg/100 ml, with the guava–karonda blend showing the maximum value. The Fecontent of the beverages ranged from 0.10 to 0.48 mg/100 ml, with the guava–amaranth blend exhibiting the highest iron content. The antinutritional content of all the developed beverages was lower than the permissible limits. All the beverages behaved as pseudoplastic fluids.
Keywords: Anaemia; Antinutrients; Fedense plant sources; Functional guava beverage; Nonheme Fe; Nutritional value.
Micronutrient deficiency, often termed ‘hidden hunger,’ affects over two billion people worldwide and is characterized by insufficient intake of essential vitamins and minerals required for growth and physiological function [29]. Iron deficiency is highly prevalent, particularly in women and children, and remains a major cause of nutritional anemia globally. There are two iron forms in nature, heme and nonheme. Heme iron is obtained from hemoglobin and is most commonly found in animal food, while nonheme iron sources can be obtained from fruits, vegetables, herbs, flowers, and seaweeds. For the vegan community, plant derived nonheme iron functional foods could be a promising food-based approach to address the problem of Fe deficiency. Ready-To-Serve (RTS) fruit beverages are the most popular functional drinks with high palatability and ease of consumption but are inherently low in Fe content [36]. Since guava is a rich source of vitamin C, has a pleasant flavor and is low in antinutrients, has a great scope to develop a delicious nonheme iron-fortified RTS.
Guava (Psidium guajava), a widely available Indian fruit, is exceptionally rich in vitamin C, providing about 200–300 mg per 100 g depending on variety and season. In addition to vitamin C, guava supplies vitamins A, calcium, phosphorus, dietary fiber, and numerous bioactive compounds, including saponins, oleanolic acid, flavonoids, quercetin, and polyphenols, all contributing to strong antioxidant and protective health effects [34]. Although highly nutritious, guava’s short postharvest shelf life encourages its use in value-added products such as beverages. Guava, like other fruits is inherently low in Fe content. However, there are other underutilized and locally available plant sources that are iron-dense. Unlike chemical fortificants, they do not possess risk of iron overload for unrelated disorders. It has been reported that Fe content of karonda is 150 mg/100 g [5], seaweed Ulva lactuca 14 mg/100 g [35], moringa (drum stick) leaves 7 mg/100 g [14], amaranth 13.6 mg/100 g [19], and wheat grass 28.94 mg/100 g Fe [11]. The extracts of these plant sources can be used for fortification of guava RTS to provide a nonheme iron rich functional drink. The presence of high ascorbic acid and low antinutrient contents in the guava matrix are expected to enhance nonheme iron bioavailability, thereby improving the nutritional relevance of the developed beverages.
The present study was aimed at developing nonheme iron-rich functional beverages using guava pulp blended with the extracts of the abovementioned Fedense plant sources. The most suitable formulation with maximum sensory acceptability can be recommended as a cost-effective nutritious dietary intervention for the vegan section of the population suffering from Fe deficiency.
Ripe fruits of guava (Psidium guajava) cv. Allahabadi safeda, firm red ripe fruits of karonda (Carissa carandas), and leaves of red amaranth (Amaranthus tricolor) were procured from the local market of Greater Noida (U.P.), India. Moringa (Moringa oleifera) leaves and wheatgrass (Agropyron sp.) were collected from the experimental field of Sharda University (Greater Noida, India), while seaweed Ulava lactuca was sourced from the Chokward region of Gujrat, India. Commercial grade white crystalline cane sugar, citric acid, xanthan gum, and sodium benzoate were obtained from local supplier. All chemicals used in this study were of analytical grade and sourced from SigmaAldrich.
Formulation of functional beverages
To develop functional nonheme iron rich beverages, the Doptimal mixture design with no blocking was applied. The number of independent factors (proportion of five plant extracts) and xanthan gum determined the number of points in the design. Overall acceptability were the responses influenced by the changes in the proportion of independent variables. The statistical software package DesignExpert 11.0.3.0, Stat Ease, Inc., Minneapolis, MN, USA, was applied for determining the experimental design and analyzing the data. (Table 1) shows the coded values and actual values of plant extracts, and xanthan gum to be added to the beverages. The center points of these designs were chosen to add ingredients to the juices to yield satisfactory experimental results. The functional nonheme iron rich beverages were obtained by the addition of different proportions of plant extracts, and xanthan gum (with predetermined concentrations) to the fruit juice blends and investigated for their physicochemical properties. The design resulted in 15 experimental runs with 3 replicates (Table 2). The data of responses were analyzed applying statistical software for selecting the best fit design and optimized formulation.
| Variables | Range of levels Low actual (ml/100 ml of beverage) | Low coded | High actual (ml/100 ml of beverage) | High coded |
|---|---|---|---|---|
| Guava pulp | 0.6 | -1 | 0.9 | +1 |
| Xanthan gum | 0.01 | -1 | 0.04 | +1 |
| Moringa oleifera | 0.1 | -1 | 0.4 | +1 |
| Amaranthus tricolor | 0.1 | -1 | 0.4 | +1 |
| Agropyron sp. | 0.1 | -1 | 0.4 | +1 |
| Ulva lactuca | 0.1 | -1 | 0.4 | +1 |
| Carissa carandas | 0.1 | -1 | 0.4 | +1 |
| Formulation | Guava pulp | Plant extracts | Xanthan Gum (%) |
|---|---|---|---|
| F1 | 0.9 | 0.1 | 0.03 |
| F2 | 0.9 | 0.1 | 0.04 |
| F3 | 0.9 | 0.1 | 0.01 |
| F4 | 0.6 | 0.4 | 0.04 |
| F5 | 0.8 | 0.2 | 0.03 |
| F6 | 0.8 | 0.2 | 0.03 |
| F7 | 0.9 | 0.1 | 0.01 |
| F8 | 0.8 | 0.2 | 0.01 |
| F9 | 0.9 | 0.1 | 0.01 |
| F10 | 0.6 | 0.4 | 0.01 |
| F11 | 0.6 | 0.4 | 0.01 |
| F12 | 0.9 | 0.1 | 0.04 |
| F13 | 0.7 | 0.3 | 0.02 |
| F14 | 0.8 | 0.2 | 0.04 |
| F15 | 0.6 | 0.4 | 0.04 |
Note: All the values are in millilitres (ml) to be added to 100 ml of beverages.
Preparation of blends of nonheme ironrich beverages
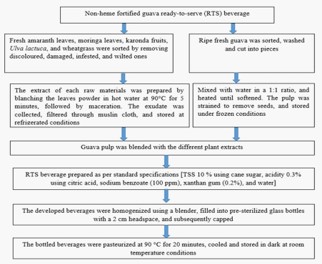
Plant materials were washed, dried in a tray dryer at 40°C for 48 h, ground using a laboratory blender (Sujata, India), and sieved through a 100 mesh sieve to obtain fine powder. The plant extract was prepared by dispersing the required quantity of dried plant powder corresponding to the selected formulation in 50 ml of distilled water, followed by blanching at 90°C for 5 min. The mixture was allowed to macerate and then filtered through muslin cloth to obtain a clear aqueous extracts of the respective plant materials.
The extracts of wheatgrass, seaweed Ulva lactuca, karonda fruits, moringa leaves and red amaranth were blended with guava pulp at proportions defined by the experimental design (Table 2). For beverage preparation (on 100 ml basis), the required amount of guava pulp and the freshly prepared plant extract were blended such that their combined pulp equivalent was 10 g per 100 ml beverage, which included the combined contribution of guava pulp and plant extract. Refined sugar, citric acid (0.3 g), xanthan gum (0.2%), and preservative (0.01%) were added, and the final volume was adjusted to 100 ml with distilled water. The total soluble solids were standardized to 10%, after which the beverage was pasteurized at 90°C for 20 min, hotfilled into sterilized bottles, cooled, and stored for further analysis (Figure 1).
Determination of Doptimal mixture composition of different formulation of blended beverages
In the first stage of this research, various functional beverages formulations were prepared using the Doptimal mixture design by blending different levels of plant extracts and xanthan gum. These formulations were evaluated for sensory attributes to identify the optimum guava pulpplant extract ratio and to determine the maximum acceptable levels of plant extract and xanthan gum. In the second stage, the selected optimum formulations were subjected to detailed physicochemical, mineral, color, and phytochemical analyses.
Evaluation of sensory properties of different formulation of blended beverages
For sensory evaluation, 30 ml of each beverage formulation generated through the Doptimal mixture design was served in transparent plastic cups coded with random three-digit numbers. A ninepoint hedonic scale, where 1 indicated ‘’dislike extremely’’ and 9 indicated ‘’like extremely’’, was used to assess consumer acceptability. The sensory panel consisted of 20 semitrained student panel-lists (men and women aged 2330 years). Panelists evaluated the formulations for taste, color and appearance, aroma, texture, consistency, and overall acceptability to determine the influence of varying levels of plant extracts and xanthan gum in the guavabased RTS beverages. This evaluation validated the consumer acceptability of the mixtures generated in the optimization stage. Sensory data were analysed using ANOVA, and significant differences were determined at p≤0.05.
Proximate composition
The different plant materials were subjected for analysis of moisture content, ash, protein, carbohydrate, and energy as per the method of AOAC [4]. The protein content was analysed by the Kjeldhal method suggested by Rangana [31] by multiplying the N value with factor 6.25.
Physiochemical analysis
The plant materials used and the formulated RTS beverages were analyzed for physicochemical properties. The pH was measured using a digital pH meter (CL54, Toshniwal Instruments, India) following standard procedure AOAC [2]. Total soluble solids (°Brix) were determined using a Benchtop Digital Refractometer (model RSG100ATC). Titratable acidity was measured using the AOAC [3] standard method. Ascorbic acid (Vitamin C) was estimated by titrimetric technique using 2,6dichlorophenolindophenol reagent, as per the procedure described by Ranganna [31]. The Folin–Ciocalteu colorimetric method, as described by Antolovich et al. [1], was employed to evaluate the Total Phenolic Content (TPC) of the samples.
Mineral analysis of raw materials and formulations
Mineral contents were determined using the atomic absorption spectrophotometric (Agilent 240FS AA, USA).) method according to AOAC [4]. Samples were first digested using 5 ml of diacid mixture of HNO3 and HClO4. The digested samples were then diluted to the 25 ml, and mineral concentrations were quantified using an atomic absorption spectrophotometer.
Antioxidant activity
The DPPH (2,2 diphenyl1picrylhydrazyl) free radical scavenging assay was used for determination of antioxidant activity, following the methodology outlined by Hussain et al. [16]. The percentage of DPPH radical scavenging activity was calculated using the following formula:
DPPH Scavenging Activity (%) = (A0Af)/ A0*100
Where: Af = final absorbance, A0 = initial absorbance
Color characteristics of raw materials and different formulated formulations
The color of the raw materials and developed beverages was determined by CIEL*, a*, and b* coordinates using (Color Quest XE, Hunter Lab, USA), which determines the: a* (green/ red), b* (blue/yellow), c* (chroma), h* (hue), and L* (lightness) values [9].
Rheological analysis of developed beverage
Rheological properties (apparent viscosity, shear rate and shear stress) of developed RTS beverages were measured using a rheometer (MCR52, Anton Paar, GmbH, Ostifildern, Germany). The measurements were carried out using a concentric cylinder arrangement (DG 26.7SN7721). The data was acquired in a personnel computer loaded with Rheoplus (v2.81, Anton Paar) software.
Antinutritional factors
The quantitative analysis of phytate, tannins, and oxalate in the samples was performed using the standard colorimetric procedures. Phytate content was estimated following the method of Vaintraub & Lapteva [44]. Briefly, 1.0 ml of sample was extracted with 10 ml of 2.4% HCL on a mechanical shaker at room temperature for 1 h, and centrifuged at 3,000 rpm for 30 min. The 3 ml supernatant was mixed with 1 ml of Wade reagent (0.03% FeCl3 6H2 O and 0.3% sulfosalicylic acid in distilled water), and absorbance was measured at 500 nm against a reagent blank. Results were expressed as μg phytic acid/g fresh weight with sodium phytate as a standard.
Tannin concentration was determined by the vanillinHCl assay as described by Butler et al. [7]. The extracted supernatant obtained after centrifugation at 3500 rpm for 10 min was reacted with 5 ml of vanillin HCL reagent, incubated in a water bath at 30°C for 20 min, and the absorbance was recorded at 500 nm using a UV visible spectrophotometer. The oxalate content was analysed following the procedure of Naik et al. [25]. In brief, 2 ml of the beverage was digested in 0.25 N HCL by boiling for 15 min. The volume made up to 50 ml, and 1 ml of the extract was mixed with 5 ml of 2 N H2SO4 and 1 ml of 0.03 M KMnO4, followed by incubation for 30 min. The absorbance was recorded at 530 nm, and oxalate concentration was determined using an oxalic acid calibration curve.
Statistical analysis
The values given are the mean of triplicate observations ± standard deviations. The obtained data were analysed using Complete Randomised Design (CRD) to test statistical significance at p≤0.05, following the method described by Panse and Sukhatme (1985). Statistical analysis was performed using the (OPSTAT Online Statistical Analysis Tools), CCS Haryana Agricultural University, Hisar, India.
Optimization of nonheme fortified Guava based RTS beverage formulation and stabilization
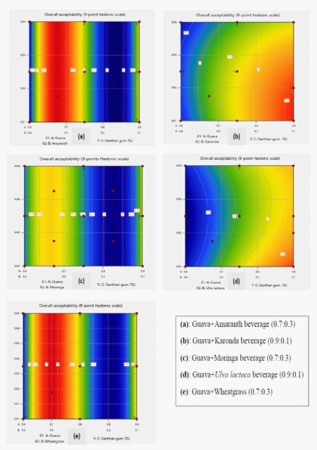
The sensory evaluation of the most acceptable formulations selected from the 15 Doptimal runs is presented in (Table 3). All guava–plant RTS beverages fell within the acceptable range on the ninepoint hedonic scale, indicating that each formulation was well received by the panelists. Significant differences (p≤0.05) were observed among blends for attributes such as color and appearance, taste, mouthfeel, and overall acceptability, which can be attributed to the compositional variation introduced by different plant extracts and their respective concentrations. Similar trends have been reported in previous studies on pumpkin–mango–based RTS beverages fortified with pomegranate seed extract, where sensory evaluation showed an improvement in aroma, flavour, and overall acceptability with increasing extract concentration up to an optimum level (6%), followed by a decline at higher levels, whereas appearance and mouthfeel scores decreased progressively with further extract addition [18]. The control sample (100% guava) retained high acceptance, due to the naturally appealing flavor and color of guava pulp. Some formulations exhibited slightly lower scores, particularly those incorporating stronger flavored extracts such as seaweed or wheatgrass, which is consistent with earlier studies reporting that such ingredients may impart characteristic herbal or marine notes Ugwuoke et al. [43] also observed a similar behavior related to the flavor of the drink with the addition of moringa powder. However, even these treatments remained within acceptable limits, demonstrating that appropriate blending ratios can successfully balance guava flavor with plantderived functional components. Based on the optimized formulations, karonda and Ulva lactuca blends achieved their best sensory scores at a guava:extract ratio of 0.9:0.1, while moringa, wheatgrass, and amaranth blends showed maximum acceptability at 0.7:0.3, with the guavaamaranth formulation recording the highest overall sensory scores among the fortified beverages. Following sensory selection, response surface and contour plots (Figure 2) were generated to understand the influence of guava: plant extract ratio and stabilizer levels on key attributes such as viscosity, taste, and overall acceptability. The plots revealed that the optimal region for maximizing sensory quality varied across plant extracts, reinforcing that each fortified beverage has its own most favorable formulation range. Overall, the findings indicated that all guava–plant RTS beverages were sensorially acceptable, with each formulation exhibiting a favorable balance of appearance, taste, and mouthfeel. This confirms the potential of using multiple plant extracts to enhance the nutritional value of guavabased beverages without compromising consumer acceptance.
| Plant extract | Optimized ratio (Guava:Extract) | Xanthan gum (%) | Taste | Aroma | Mouthfeel | Color & appearance | Overall acceptability |
|---|---|---|---|---|---|---|---|
| Control | 1:00 | 0.02 | 8.00a | 8.12a | 7.95a | 8.00a | 8.02a |
| Karonda | 0.9:0.1 | 0.02 | 7.54b | 7.46b | 7.67ab | 8.24a | 7.73b |
| Moringa | 0.7:0.3 | 0.02 | 7.20c | 7.50b | 6.85c | 7.85ab | 7.35c |
| Wheatgrass | 0.7:0.3 | 0.02 | 6.75d | 7.17c | 6.50d | 7.80b | 7.05d |
| Ulva lactuca | 0.9:0.1 | 0.02 | 6.12e | 5.19e | 6.12e | 6.50c | 6.40e |
| Amaranth | 0.7:0.3 | 0.02 | 7.85a | 7.56b | 7.85a | 8.20a | 7.86b |
Values are mean sensory scores. Different superscript letters within the same column indicate significant differences (p<0.05).
Proximate and physicochemical composition of the plant materials
The data for nutritional analysis of guava and other plant materials is presented in (Table 4). On a dry weight basis, moisture content ranged from 7.35% in moringa leaves to 21.91% in karonda fruits, while guava pulp exhibited moderate moisture (8.45%). Ash content was higher in Ulva lactuca (10.36%) and amaranth leaves (10.12%), reflecting their superior mineral content necessary for a healthy diet [42,17]. However, guava showed relatively lower ash content (1.23%). Protein content was notably high in wheatgrass (35.00%) and moringa leaves (32.65%), highlighting their potential as proteinrich fortifying ingredients. In contrast, guava pulp contained low protein (2.13%), consistent with previous reports on tropical fruits [8]. Guava also contained very low fat (0.54%). Guava pulp showed highest carbohydrate content (87.65%) and total soluble solids (11%). Acidity and pH varied significantly among samples, karonda exhibited high acidity (2.18%) and low fat (2.75%), whereas Ulva lactuca showed alkaline pH (8.40). Guava maintained moderate acidity (0.24%) and pH (3.83), desirable for flavour balance and microbial stability. Phytochemical analysis revealed exceptionally high total phenolic content in amaranth leaves (422.62 mg GAE/100g). Similar values were reported for amaranth by Jahan et al. [17].
Physicochemical characteristics of the developed beverages
The data for physicochemical characteristics of the developed beverages is presented in (Table 5). The Total Soluble Solids (TSS) of all guavabased RTS beverage formulations were standardized at 10%, and there was not any variation observed among the control and plant-extract fortified beverages, indicating that the incorporation of different plant extracts did not influence the TSS. Titratable acidity, expressed as citric acid, was optimized at approximately 0.30% across all formulations. The acidity values ranged from 0.28 to 0.35% and no significant change was observed following the addition of plant extracts, However, pH value ranged from 3.16 to 3.38, which is within the desirable acidic range for fruit beverage, thereby contributing to microbial safety and product stability [12].
The total phenolic content of the beverages varied from 23.07 to 31.21 mg GAE/100mL, with the guava–moringa formulation exhibiting the highest phenolic content. The observed increase in phenolics in fortified formulations can be attributed to the contribution of bioactive compounds from plant extracts [20,38]. Vitamin C content ranged from 7.95 to 14.77 mg/100 mL, with the guava–karonda blend showing the maximum value, reflecting the natural ascorbic acid richness of karonda fruits. Antioxidant activity ranged from 62.41 to 78.27%, and higher activity was generally associated with increased phenolic and vitamin C content, consistent with previous findings in fortified RTS beverages [8]. Protein content showed minor variation (0.190.28g/100 ml) among formulations, indicating limited but measurable nutritional enhancement with respect to protein content.
| Chemical analysis (%) | Wheatgrass | Ulva lactuca | Karonda | Moringa | Amaranth | Guava |
|---|---|---|---|---|---|---|
| Moisture (% dw) | 7.42±0.02 | 15.99±0.01 | 21.91±0.03 | 7.35±0.12 | 15.42±0.14 | 8.45±0.82 |
| Ash (% dw) | 4.27±0.14 | 10.36±0.12 | 5.55±0.07 | 2.27±0.08 | 10.12±0.05 | 1.23±0.12 |
| Crude fat (% dw) | 2.15±0.13 | 1.23±0.15 | 4.38±0.23 | 5.45±0.12 | 1.36±0.07 | 0.54±0.05 |
| Crude protein (% dw) | 35.00±0.16 | 18.66±0.02 | 9.30±0.06 | 32.65±0.02 | 13.12±0.04 | 2.13±0.17 |
| Carbohydrate (% dw) | 51.16±0.12 | 53.76±0.17 | 58.86±0.05 | 52.28±0.08 | 59.98±0.03 | 87.65±0.19 |
| Energy (kcal/100g) | 363.99±0.03 | 300.75±0.03 | 312.06±0.02 | 388.77±0.06 | 304.64±0.56 | 363.98±0.03 |
| Acidity (%) | 0.64±0.005 | 0.01±0.01 | 2.18±0.01 | 0.13±0.001 | 0.13±0.01 | 0.24±0.02 |
| pH | 5.81±0.01 | 8.40±0.1 | 2.75±0.01 | 6.31±0.01 | 6.70±0.15 | 3.83±0.01 |
| TSS (%) | 3.00±0.02 | 1.00±0.05 | 6.00±0.28 | 5.00±0.10 | 4.00±0.01 | 11±0.15 |
| Phenolic compound (mg/100 g GAE) | 115.49±0.55 | 25.87±0.21 | 62.45±0.05 | 63.65±0.18 | 422.62±0.43 | 172±0.26 |
| Antioxidant % | 60.17±0.37 | 1.2±0.15 | 4.12±0.21 | 87.22±0.19 | 85.42±0.24 | 96.81±0.18 |
| Vitamin C (mg/100 g) | 76.15±0.29 | 1.2±0.15 | 6.35±0.19 | 259.74±0.28 | 49.26±0.19 | 262.5±0.17 |
The values are mean ± S.D. of three replicates.
| Parameters | A | B | C | D | E | F |
|---|---|---|---|---|---|---|
| TSS (°Brix) | 10±0.00 | 10±0.00 | 10±0.00 | 10±0.00 | 10±0.00 | 10±0.00 |
| Titratable acidity (%) | 0.30±0.06 | 0.31±0.01 | 0.33±0.01 | 0.35±0.02 | 0.28±0.01 | 0.30±0.01 |
| pH | 3.16±0.12 | 3.35±0.01 | 3.35±0.015 | 3.37±0.015 | 3.38±0.01 | 3.31±0.01 |
| Total phenols (mg GAE/100 ml) | 23.34±0.16 | 23.21±2.5 | 29.97±1.36 | 23.07±0.16 | 31.21±0.24 | 28.45±0.31 |
| Vitamin C (mg/100 ml) | 10.37±0.12 | 11.36±0.01 | 14.77±0.18 | 8.23±0.05 | 7.95±0.05 | 9.55±0.01 |
| Antioxidant (%) | 67.95±2.12 | 77.26±3.20 | 62.41±3.85 | 78.27±3.35 | 66.44±1.99 | 66.89±3.42 |
| Protein (g/100 ml) | 0.21±0.21 | 0.19±0.08 | 0.22±0.12 | 0.28±0.09 | 0.26±0.08 | 0.19±0.01 |
Means ± standard deviation (N=3).
A: Guava 100% beverage (Control); B: Guava+Amaranth beverage (0.7:0.3); C: Guava+Karonda beverage (0.9:0.1); D: Guava+Wheatgrass beverage (0.7:0.3); E: Guava+Moringa beverage (0.7:0.3); and F: Guava+Ulva lactuca (0.9:0.1)
Color analysis
The instrumental color parameters (L*, a*, b*) showed marked variations among the underutilized plant materials (Table 6), reflecting differences in their natural pigment composition. Lower L* values observed in amaranth and Ulva lactuca indicated a darker appearance, while higher L* values in guava and karonda reflected lighter matrices. Negative a* values in wheatgrass, moringa and Ulva confirmed the dominance of chlorophyll pigments, whereas positive a* values in karonda and amaranth were associated with red coloration due to anthocyanins [40,13]. Positive b* values across most samples indicated yellow contributions from carotenoids and phenolic compounds, consistent with reports on leafy and fruit-based plant materials [28].
In the developed guavabased RTS beverages, fortification with plant extracts resulted in a reduction of L* values compared with the guava control, indicating darkening of the beverages after blending and thermal processing. The lowest L* value was recorded for the guava–amaranth RTS, while guava–Ulva retained comparatively higher lightness. The guava–karonda RTS exhibited the highest a* value, confirming the strong influence of anthocyanin pigments on beverage redness. Overall, the observed changes in L*, a* and b* values can be attributed to pigment dilution, interactions with the guava matrix, and processing induced reactions, which are well documented in fruit-based RTS beverages [32,6].
| Parameters | Wheatgrass | Ulva lactuca | Karonda | Moringa | Amaranth | Guava (Control) |
|---|---|---|---|---|---|---|
| Dried plant materials | ||||||
| L* | 53.71±0.04 | 42.20±0.12 | 58.55±0.31 | 49.7±0.49 | 40.12±0.10 | 55.23±0.11 |
| a* | -8.36±0.05 | -4.08±0.12 | 11.6±0.07 | -9.51±0.06 | 13.28±0.05 | 1.23±0.17 |
| b* | 24.27±0.13 | 20.31±0.16 | 27.57±0.07 | 27.04±0.08 | 3.24±0.07 | 1.22±0.19 |
| Developed fortified RTS beverages of guava | ||||||
| L* | 31.35±0.049 | 46.06±0.46 | 31.61±0.32 | 37.47±0.37 | 16.99±0.47 | 50.86±0.26 |
| a* | -1.29±0.07 | 3.69±0.005 | 10.38±0.05 | 1.31±0.02 | 0.84±0.19 | 2.53±0.04 |
| b * | 4.71±0.16 | 3.86±0.23 | 4.91±0.06 | 3.6±0.10 | 4.33±0.20 | 3.29±0.06 |
Values are expressed as mean ± SD (n=3).
Antinutrient content
The antinutritional content of the plant materials and their corresponding guavabased RTS beverages is presented in (Table 7). Among the raw materials (dry weight basis), karonda exhibited comparatively higher levels of phytic acid, tannic acid, and oxalate than the other plant sources, while amaranth, moringa, and Ulva lactuca showed moderate to low concentrations of these antinutrients. Such variations in the antinutritional factors among plant foods have been attributed to species differences, growing conditions, and inherent defense mechanisms [15]. In the formulated RTS beverages, tannic acid (0.020.12%), oxalate (3.353.41%), and phytic acid (0.010.05%) contents were low, with only marginal increases observed in fortified formulations compared to the control. The substantially reduced antinutrient levels in beverages may be attributed to dilution effects and processing steps involved in extract preparation and beverage formulation, as reported for plantbased foods and beverages [45]. Moreover, leafy plant sources such as amaranth and moringa are known to contain manageable levels of antinutritional factors when processed, without significantly compromising nutritional quality [38]. Similarly, Ulva lactuca has been reported to possess relatively low levels of conventional antinutrients as compared to terrestrial leafy vegetables [42]. Overall, the results indicated that incorporation of selected plant extracts into guavabased RTS beverages did not lead to excessive antinutrient accumulation, supporting their nutritional suitability. It has been reported by that the permissible limits are 2005000 mg of phyates [21], 0.10.5 mg of tannins [10], and 4050 mg for oxalate [39], respectively. Thus, the antinutritional content of all the developed beverages were lower than the permissible limits, indicating their suitability for consumption. Moreover, higher vitamin C content and lower antinutrients present in these beverages are expected to improve iron solubility and bioavailability by chelating iron and reducing inhibitory interactions [41].
| Anti-nutritional factors | Guava pulp fresh | Wheatgrass | Ulva lactuca | Karonda | Moringa | Amaranth |
|---|---|---|---|---|---|---|
| Dried plant materials | ||||||
| Tannic acid (%) | - | 2.28±0.36 | 0.29±0.08 | 13.43±1.27 | 0.9±0.23 | 1.54±0.09 |
| Oxalate (%) | 0.3±0.01 | 1.92±0.20 | 1.64±0.25 | 3.45±0.03 | 2.44±0.13 | 1.67±0.05 |
| Phytic acid (%) | - | 1.6±0.04 | 1.66±0.07 | 8.59±0.64 | 2.39±0.09 | 2.35±0.11 |
| Developed fortified RTS beverages of guava | ||||||
| Tannic acid (%) | 0.02±0.01 | 0.08±0.03 | 0.06±0.12 | 0.12±0.14 | 0.07±0.19 | 0.07±0.02 |
| Oxalate (%) | 3.35±-0.36 | 3.39±0.32 | 3.38±0.28 | 3.40±0.21 | 3.39±0.22 | 3.41±0.38 |
| Phytic acid (%) | 0.01±0.08 | 0.01±0.00 | 0.04±0.07 | 0.03±0.01 | 0.01±0.08 | 0.05±0.09 |
Values are expressed as mean±SD (n=3). Antinutritional factors of plant materials are reported on a dry weight basis, whereas guava pulp and RTS beverages are expressed on a fresh weight basis. DW: dry weight.
Mineral composition of raw materials and guava based RTS beverages
The iron and calcium contents of selected raw plant are presented in (Table 8). Significant variations were observed among the samples’ iron and zinc contents, indicating differential contributions of plant extracts to the mineral profile. Among the raw materials, Ulva lactuca exhibited exceptionally high iron content (13.60 mg/100 g in the extract; 135.80 mg/100 g in the plant material) compared to other plants used, which is consistent with previous findings on mineral accumulation in macroalgae [42]. Amaranth leaves also demonstrated appreciable iron content (26.86 mg/100 g dry basis), supporting reports that amaranth leaves are rich sources of dietary minerals [20]. Moringa showed the highest calcium concentration among the raw materials (1543 mg/100 g), aligning with literature highlighting moringa as a calciumdense plant food [38]. The wheat grass, however, contained relatively lower levels of iron and calcium.
| Plant material | Extracts (mg/100 ml) | Iron content (mg/100g DW) | Calcium (mg/100 g DW) |
|---|---|---|---|
| Amaranth | 5.61±0.12 | 26.86±0.01 | 554.20±0.12 |
| Moringa | 0.69±0.01 | 8.06±0.23 | 1543±0.17 |
| Wheatgrass | 0.13±0.12 | 1.80±0.19 | 92.65±0.12 |
| Karonda | 0.69±0.18 | 5.03±0.25 | 457.44±0.23 |
| Ulva lactuca | 13.60±0.23 | 135.80±0.21 | 220.77±0.31 |
Values are expressed as mean±SD (n=3). DW: dry weight
The mineral composition of the developed fortified beverages of guava is presented in (Table 9). In the guava control beverage, iron was not detected and calcium (7.9 mg/100 ml) content was low; however, incorporation of plant extracts resulted in enhanced mineral content in the fortified formulations. The guava–amaranth blend exhibited the highest iron among beverages (0.48 mg/100 ml), while the guava–moringa beverage demonstrated the highest calcium content (11.9 mg/100 ml), reflecting the mineral profiles of the respective raw materials. Magnesium and zinc were also increased in fortified beverages, notably in formulations containing moringa and Ulva lactuca. Selenium was not detected in any formulation, consistent with low selenium levels reported in many plant foods [45]. Overall, the incorporation of iron and calciumrich plant extracts significantly improved the mineral profile of guavabased RTS beverages, enhancing their mineral value and potential to contribute, particularly the iron.
| Minerals | Guava (control) | Amaranth | Karonda (Karonda) | Wheatgrass | Moringa | Ulva lactuca |
|---|---|---|---|---|---|---|
| Iron | - | 0.48 | 0.11 | 0.22 | 0.1 | 0.14 |
| Calcium | 7.9 | 8.2 | 7.6 | 4.6 | 11.9 | 5.9 |
| Magnesium | 4.1 | 7.1 | 5.1 | 4.8 | 7.4 | 9.2 |
| Zinc | 0.04 | 0.07 | 0.02 | 0.05 | 0.08 | 0.09 |
| Selenium | ND | ND | ND | ND | ND | ND |
Rheological analyses
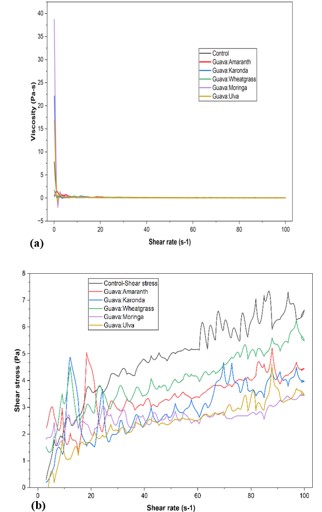
The viscosity shear rate curves (Figure 3a) show that all guava–plant extract beverages exhibited a rapid decline in apparent viscosity with increasing shear rate, confirming typical shearthinning (pseudoplastic) behavior. The overall trend remained consistent across samples, although slight differences appeared among wheatgrass and moringa enriched blends. Similar pseudoplastic behavior were observed by Pinto et al. [30] for the developed plant based beverages.
The shear stress–shear rate profiles (Figure 3b) displayed a nonlinear relationship between shear rate and shear stress, further supporting nonNewtonian flow. Similar rheological patterns have been reported for blended fruit beverages and vegetable extracts, where fiberrich matrices contribute to pseudoplastic flow [26]. The results confirmed that the incorporation of different plant extracts did not alter the fundamental flow behavior of guava pulp; all beverages behaved as pseudoplastic fluids, which is desirable for ready-to-serve beverages because it improves pourability and sensory perception [37].
This study demonstrated that iron rich plant extracts can be effectively incorporated into guava pulp to develop nonheme iron rich RTS functional beverages. The Doptimal mixture design efficiently identified optimal blending ratios that maximized sensory acceptance while enhancing nutritional quality. Based on the optimized formulations, karonda and Ulva Lactuca blends achieved their best sensory scores at a guava: extract ratio of 0.9:0.1, while moringa, wheatgrass, and amaranth blends showed maximum acceptability at 0.7:0.3, with the guavaamaranth formulation recording the highest overall sensory scores among the fortified beverages. Fortification significantly increased the iron content of the developed beverages compared to the control guava RTS, with the optimized formulation attaining an iron level of 048 mg/100 ml. The developed plant based guava beverages may be recommended as a cost-effective and refreshing dietary intervention for the vegan segment of the population affected by iron deficiency. The use of other additives to improve the microbial safety and sensory perception of these Fefortified beverages could be another area for further studies. Further research on the bioavailability and shelflife stability is recommended to support commercial application.
Conflict of interest: Authors declare no conflict of interest.
Human ethics and consent to participate: This study did not involve a clinical trial or any research involving human participants or animals. Human ethical approval for sensory evaluation involving human participants approved by the Sharda University Research Ethics Review Committee in accordance with the sensorial evaluation relevant guidelines and regulations (ISO 4121:2003). Sensory evaluation of the product was conducted by semi trained panelists (aged 20 years and above). They were verbally informed about the product to minimize health risks such as allergies or food intolerances. They were also briefed on the study’s purpose, the nature of the information to be collected, their right to withdraw at any time, and the confidentiality of their responses. Participation was entirely voluntary, and no compensation was provided. Informed consent to participate was obtained from all panelists.
Consent for publication: Both the authors agreed to publish the results.
Data availability: The datasets generated during and/ or analyzed during the current study are available from the corresponding author on reasonable request.
Author contributions: Usha Sharma: investigation, writing original draft; Saleem Siddiqui: conceptualization, data interpretation, manuscript reviewing.
Funding: The authors did not receive any external funding from any organization for the submitted work.